✨ PromQL Cheat Sheet: A Quick Guide to Prometheus Query Language

Prometheus is an open-source monitoring and alerting toolkit that has gained significant popularity in DevOps and systems monitoring. At the core of Prometheus lies PromQL (Prometheus Query Language), a powerful and flexible query language used to extract valuable insights from the collected metrics. In this guide, we will explore the basics of PromQL and provide query examples for an example use case.
Example Scenario
You have a high availability web app that you maintain. You'd like to have some observability into the traffic of your application. Your environment consists of 3 production web servers and 1 staging web server. Below is a table of instance vectors for your servers.
| Server Instance | environment | http_requests_total(t0) | http_requests_total(t1) |
|---|---|---|---|
| web_prod_1 | production | 100 | 110 |
| web_prod_2 | production | 200 | 220 |
| web_prod_3 | production | 300 | 330 |
| web_stg_1 | staging | 10 | 20 |
Querying Time Series
PromQL allows you to query time series data, which consists of metrics and their corresponding labels. The basic syntax for querying time series is as follows:
<metric_name>{<label_name>=<label_value>, ...}
Example:
To query the total HTTP requests metric for your fleet of servers, you would use:
http_requests_total
The above example would return an instance vector for each server in your fleet.
{__name__="http_requests_total", server="web_prod_1", environment="production"} = [100, 110]
{__name__="http_requests_total", server="web_prod_2", environment="production"} = [200, 220]
{__name__="http_requests_total", server="web_prod_3", environment="production"} = [300, 330]
{__name__="http_requests_total", server="web_stg_1", environment="staging"} = [10, 20]
Instance Vector Selectors
Instance vector selectors allow you to filter and focus on specific labels to extract relevant metrics. To filter the time series, append a comma-separated list of label matchers in curly braces {}
http_requests_total{environment="production"}
The above example would return an instance vector for each production server in your fleet.
{__name__="http_requests_total", server="web_prod_1", environment="production"} = [100, 110]
{__name__="http_requests_total", server="web_prod_2", environment="production"} = [200, 220]
{__name__="http_requests_total", server="web_prod_3", environment="production"} = [300, 330]
Label Matching Operators
Additionally, PromQL provides the following label matching operators:
=: Select labels that are exactly equal to the provided string.!=: Select labels that are not equal to the provided string.=~: Select labels that regex-match the provided string.!~: Select labels that do not regex-match the provided string.
Regex matches are fully anchored. A match of env=~"foo" is treated as env=~"^foo$". You can test your regex matches here using the Golang flavor.
So, to select all of our staging servers, we could use the following query:
http_requests_total{server=~".*_stg_.*"}
Aggregation Functions
PromQL provides various aggregation functions to summarize and aggregate time series data. Here are a few commonly used functions:
sum: Calculates the sum of all matching time series.avg: Computes the average value of matching time series.min: Returns the minimum value among all matching time series.max: Returns the maximum value among all matching time series.
Example:
To calculate the average HTTP requests across all production instances, you can use:
avg(http_requests_total{environment="production"})
and The above would first return the instance vectors and then generate the average:
{__name__="http_requests_total", server="web_prod_1", environment="production"} = [100, 110]
{__name__="http_requests_total", server="web_prod_2", environment="production"} = [200, 220]
{__name__="http_requests_total", server="web_prod_3", environment="production"} = [300, 330]

  [100, 200]
  [200, 400]
  [300, 600]
+ ----------
  [600, 1200]
÷    3,    3
  -----------
= [200, 400]

{__name__="avg(http_requests_total{environment="production"})"} = [200, 400]
Range Vectors and Functions
PromQL allows you to work with range vectors, representing time series data over a specified time range. This is particularly useful for analyzing trends and patterns. Here are a few important range functions:
rate: Calculates the "per-second rate of increase" of a time series over a specified time range.irate: Similar torate, but calculates the "instantaneous per-second rate of increase" of a time series over a specified time range by only considering the last 2 points.increase: Computes the "absolute increase" in a time series value over a specified time range.
Enjoying this content? Check out our full article on Counter Rates and Increases here: https://pagertree.com/learn/prometheus/promql/counter-rates-and-increases
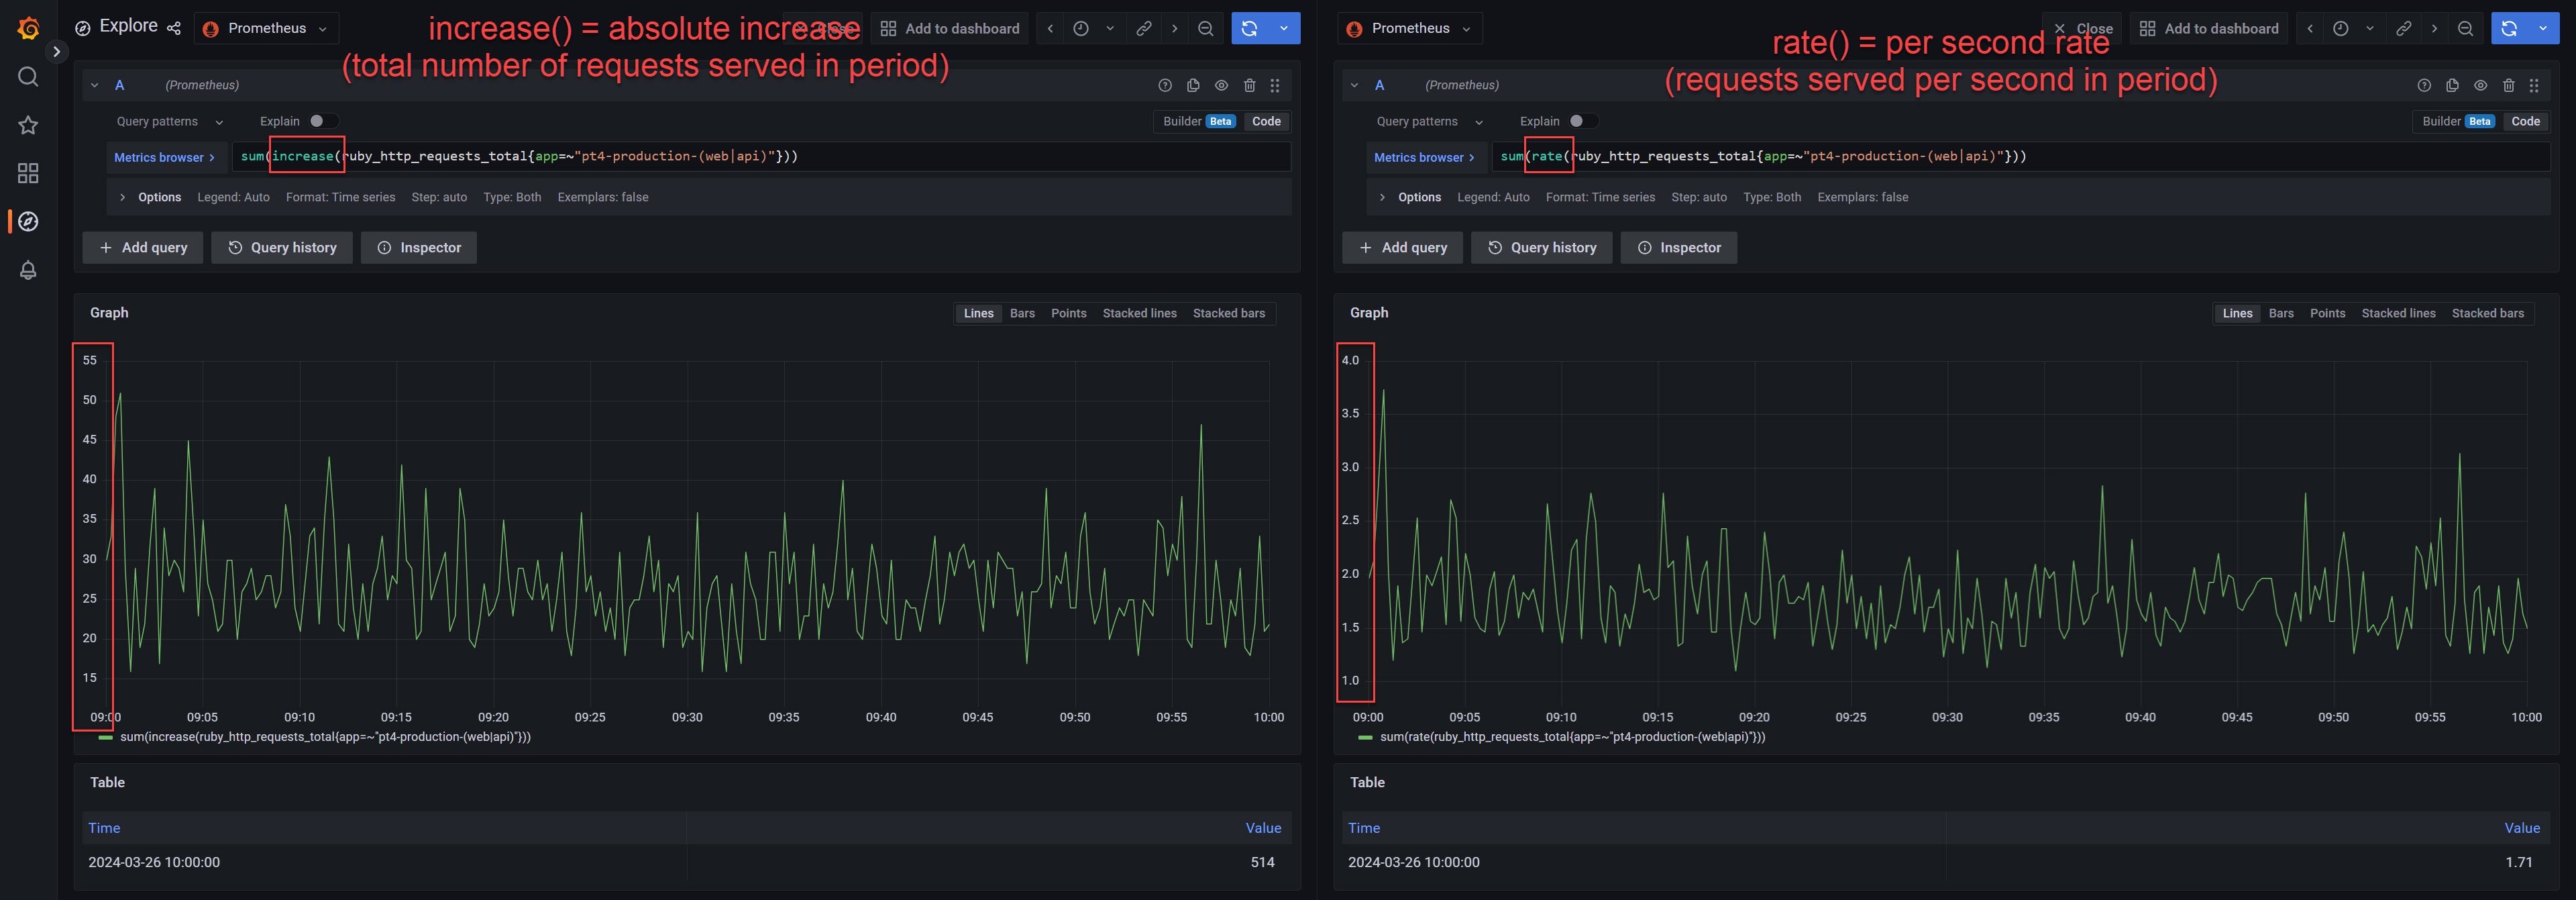
PromQL: increase vs rate functions
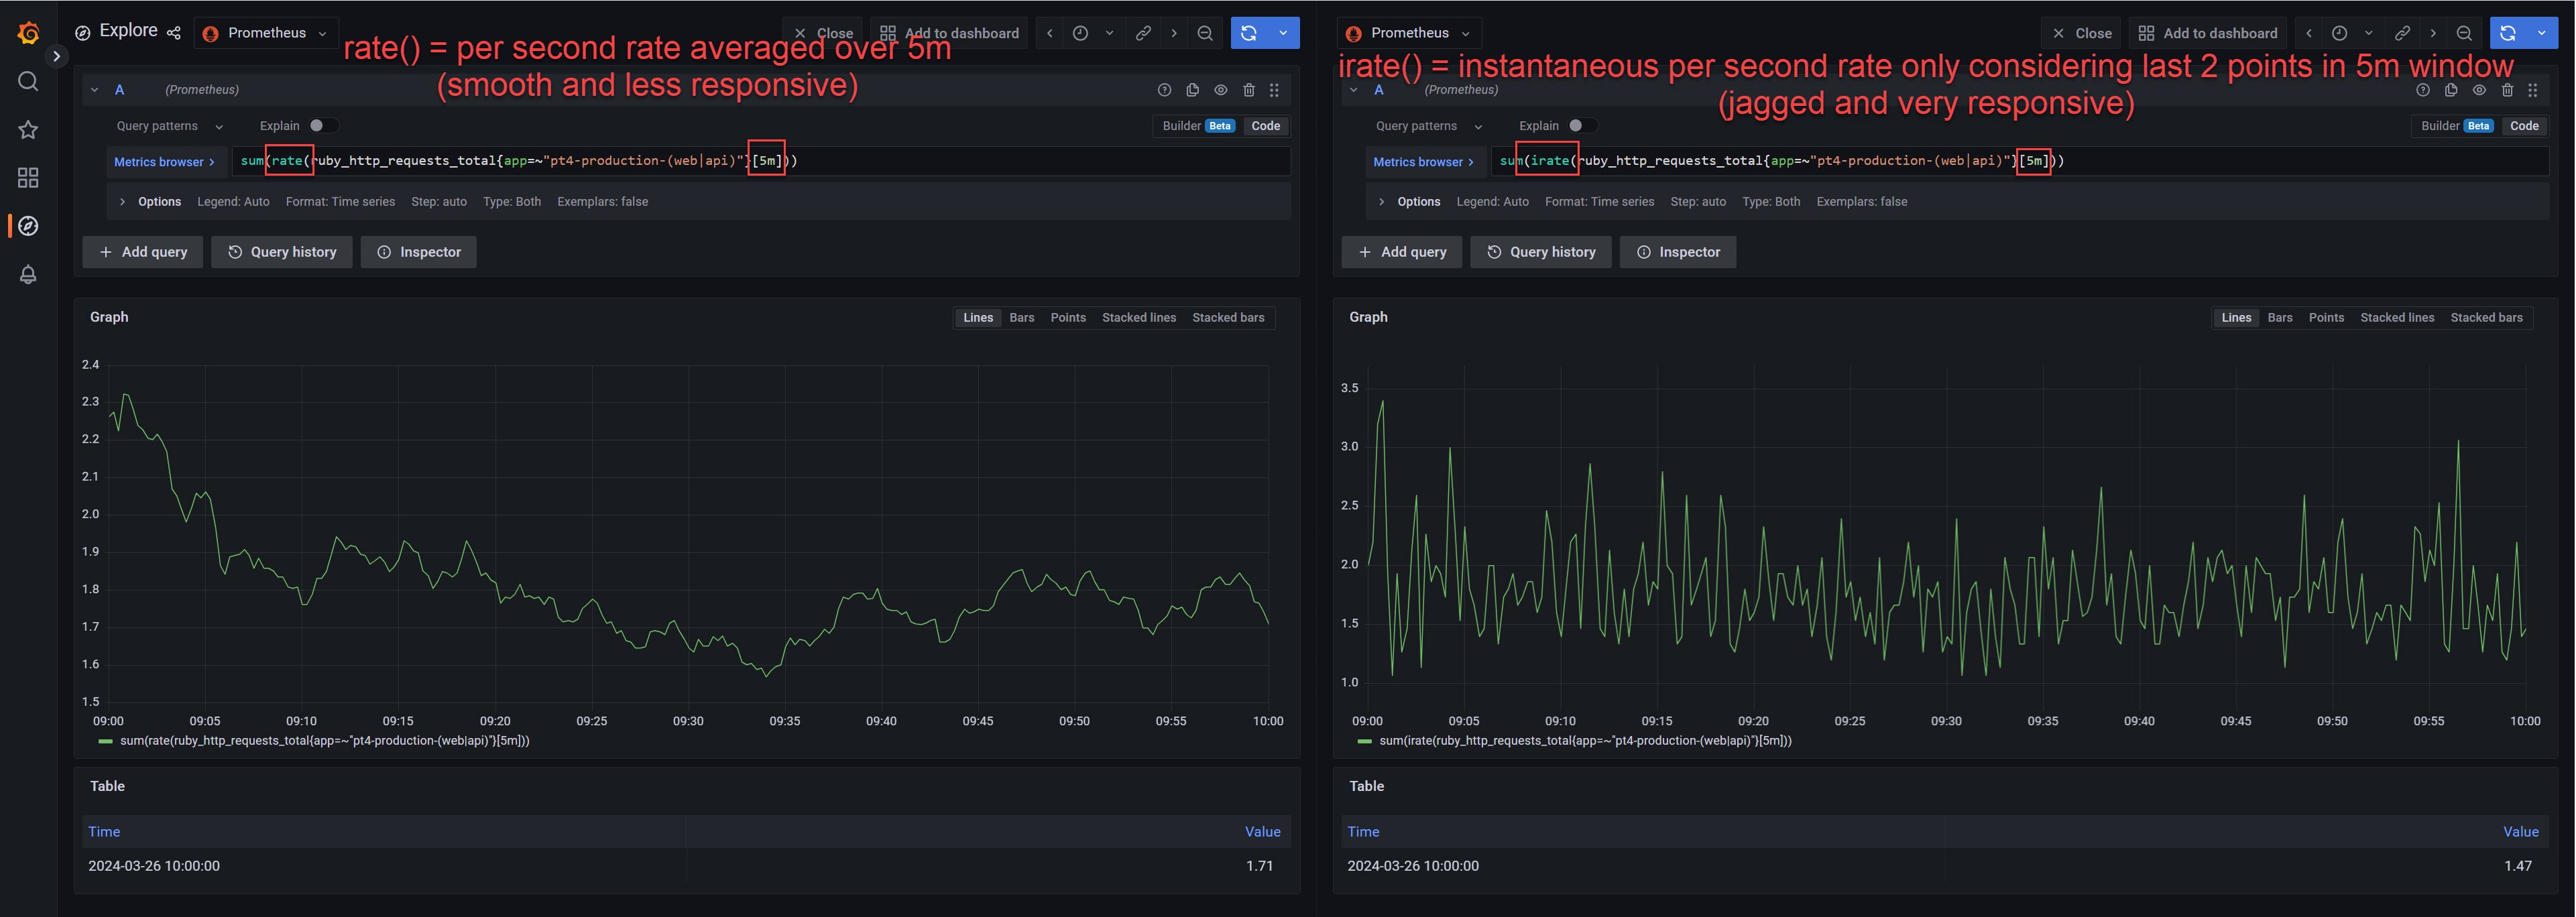
PromQL: rate vs irate functions
Example:
To calculate the number of HTTP requests you are getting for your entire production fleet.
sum(increase(http_requests_total{environment="production"}))
The above would first return the instance vectors, then calculate the difference between the vector values t1-t0, then sum them.
{__name__="http_requests_total", server="web_prod_1", environment="production"} = [100, 110]
{__name__="http_requests_total", server="web_prod_2", environment="production"} = [200, 220]
{__name__="http_requests_total", server="web_prod_3", environment="production"} = [300, 330]

  [100, 200] -> increase() = 200 - 100 ->   100
  [200, 400] -> increase() = 400 - 200 ->   200
  [300, 600] -> increase() = 600 - 300 ->   300
                                         + -----
                                         =  600

{__name__="increase(sum(http_requests_total{environment="production"}))"} = [600]
Conclusion
PromQL is a versatile and powerful query language that empowers users to extract valuable insights from Prometheus metrics. By mastering the basics covered in this cheat sheet, you'll be well-equipped to explore and analyze your monitoring data effectively. Remember, this blog post only scratches the surface. Experiment with different functions and operators to make the most of PromQL's capabilities.
By keeping this cheat sheet handy, you'll be able to navigate PromQL queries efficiently and unlock the full potential of Prometheus for monitoring and alerting in your systems.
PromQL Queries Used At PagerTree
At PagerTree we monitor our systems extensively; here are some of the common queries we use. The metrics (and metric names) we use are provided by the discord/prometheus_exporter gem or our own metric label name.
- HTTP Response Count By Status Code
- Alerts Total
- Notifications Total By Channel
- Sidekiq Queue Latency By Queue
HTTP Response Count by Status Code
Query:
sum(increase(fly_app_http_responses_count{app="pt4-[[environment]]-web"})) by (status) > 0
Graphed Result
-be20df3bec48fd47e6158e3f5bd1c97b.png)
Alerts Total
Query:
sum(increase(ruby_pagertree_alerts_total{app=~"pt4-[[environment]]-.*"}))
Graphed Result:
-1267981f925c76bdd531c422a2ea8e6f.png)
Notifications Total By Channel
Query:
sum(increase(ruby_pagertree_message_notifications_total{app=~"pt4-[[environment]]-.*"})) by (channel)
Graphed Result:
-439dd66c149733baf302f4db09581d2f.png)
Sidekiq Queue Latency By Queue
Query:
avg(ruby_sidekiq_queue_latency_seconds{app="pt4-[[environment]]-worker"}) by (queue)
Graphed Result:
-331c1cb224ddabc0d3d9cd21b8dbf7fc.png)
Resources
-

Prometheus Cheat Sheet
- Prometheus Cheat Sheet PDF
- ⭐ Link to full Prometheus Knowledge Hub