Hydrozen
| Company | Estimated Time | Vendor Docs | Open Source |
|---|---|---|---|
| Hydrozen LLC | 1 minute | view | v3.rb |
What is Hydrozen?
Hydrozen is a simple uptime monitoring and status page software.
How It Works
Hydrozen triggers user-defined notifications by monitoring websites.
- When a website, ping, port, or heartbeat monitor is down ("not ok") in Hydrozen, an alert is created in PagerTree automatically.
- When a website, ping, port, or heartbeat monitor is up ("ok") in Hydrozen, the alert is resolved in PagerTree automatically.
- When a domain or SSL monitor triggers an expiration notification in Hydrozen, an alert is created in PagerTree automatically.
Integration Walkthrough
In this integration tutorial we will show you how to send notifications from Hydrozen into PagerTree. The estimated time for this integration is 1 minute. We assume that you already have a PagerTree and Hydrozen account set up.
In PagerTree
- Create the integration by clicking the Hydrozen logo.
- Copy the Endpoint URL.
In Hydrozen
Create the Notification Handler
-
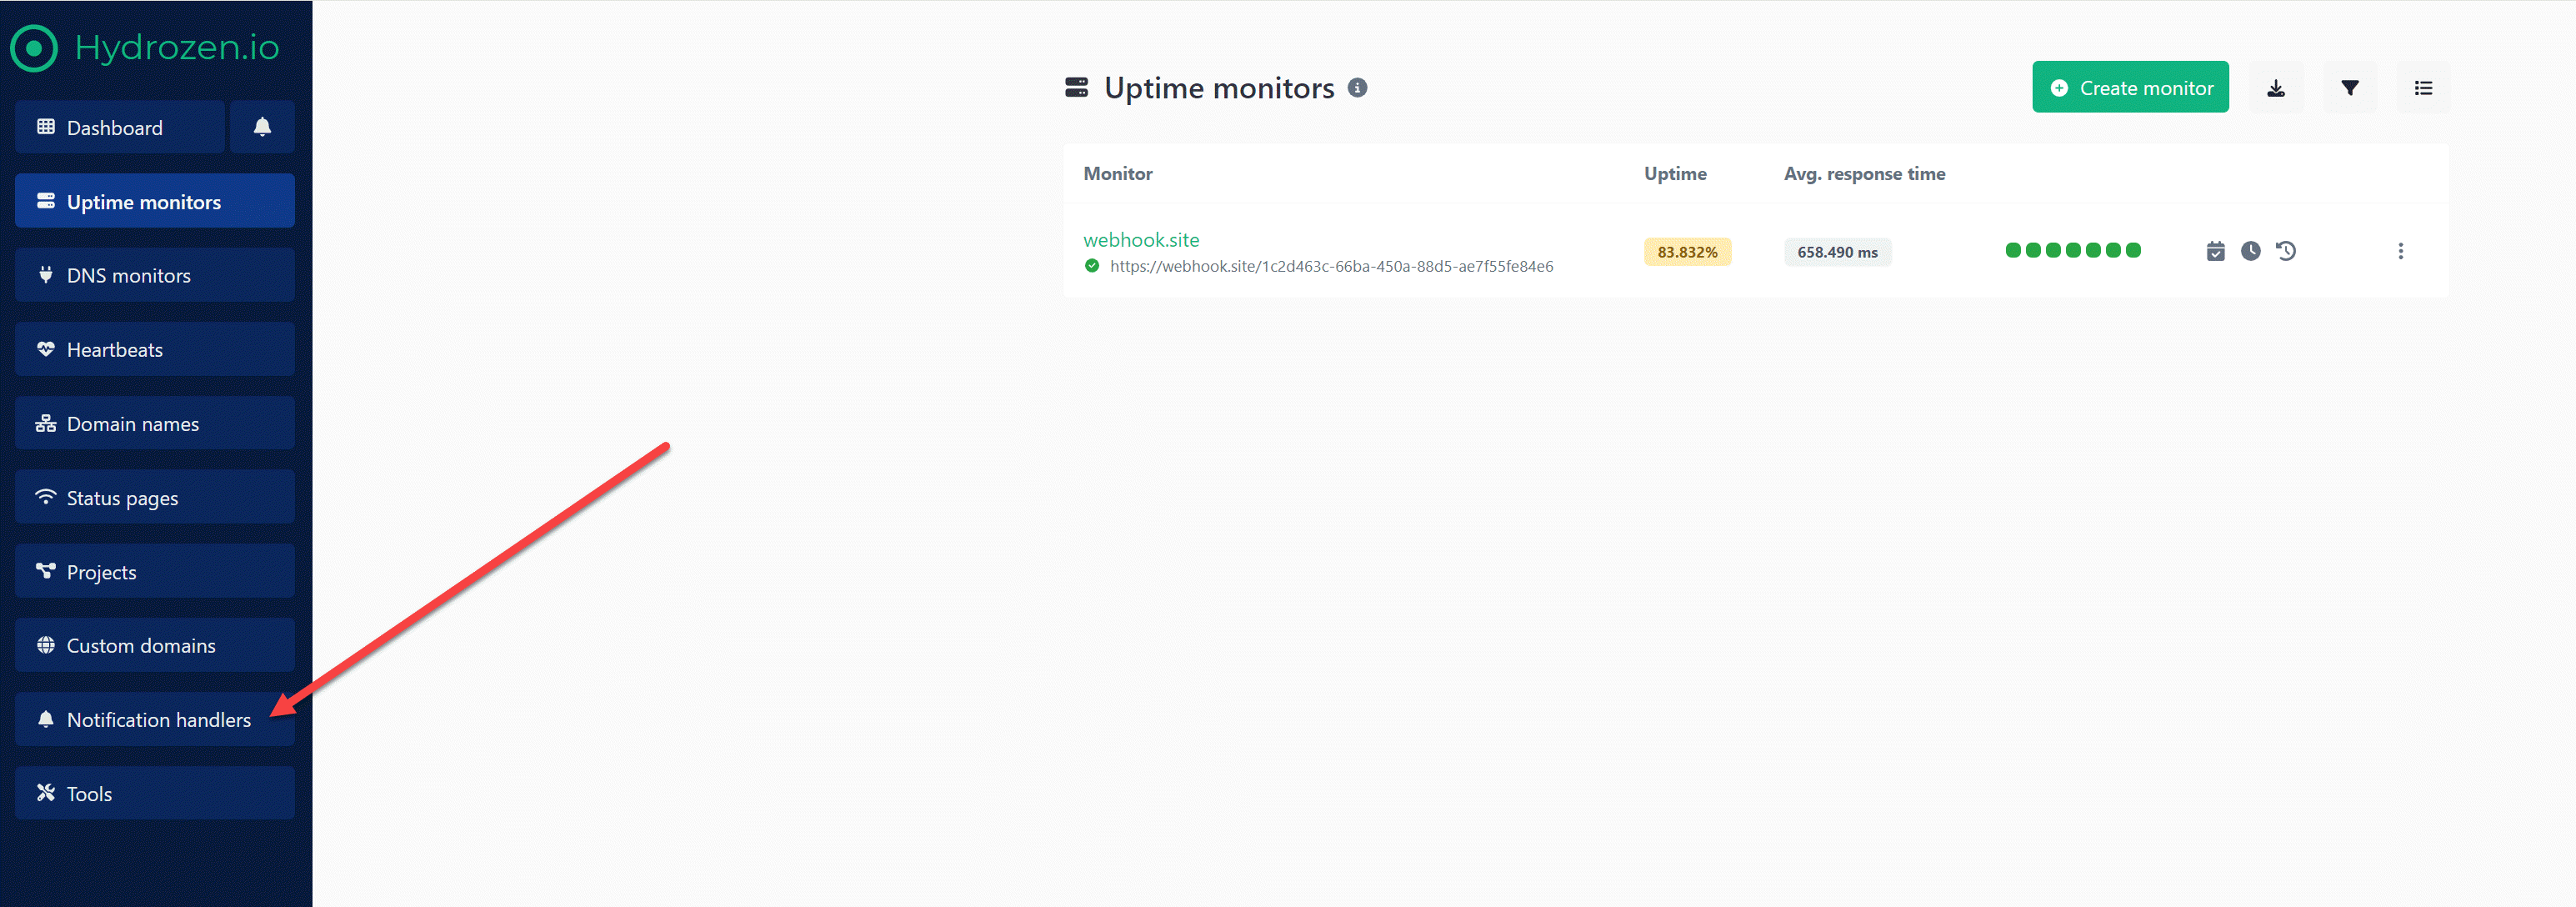
From the Left Menu, click Notification handlers.
From the Left Menu, click Notification handlers.
-
Click Create notification handler button.

Click Create notification handler button.
-
In the create a new notification handler form
- Name - Something descriptive (ex: "PagerTree")
- Notification type - Webhook
- Webhook URL - Paste the PagerTree Endpoint URL you copied
-
Click Create.
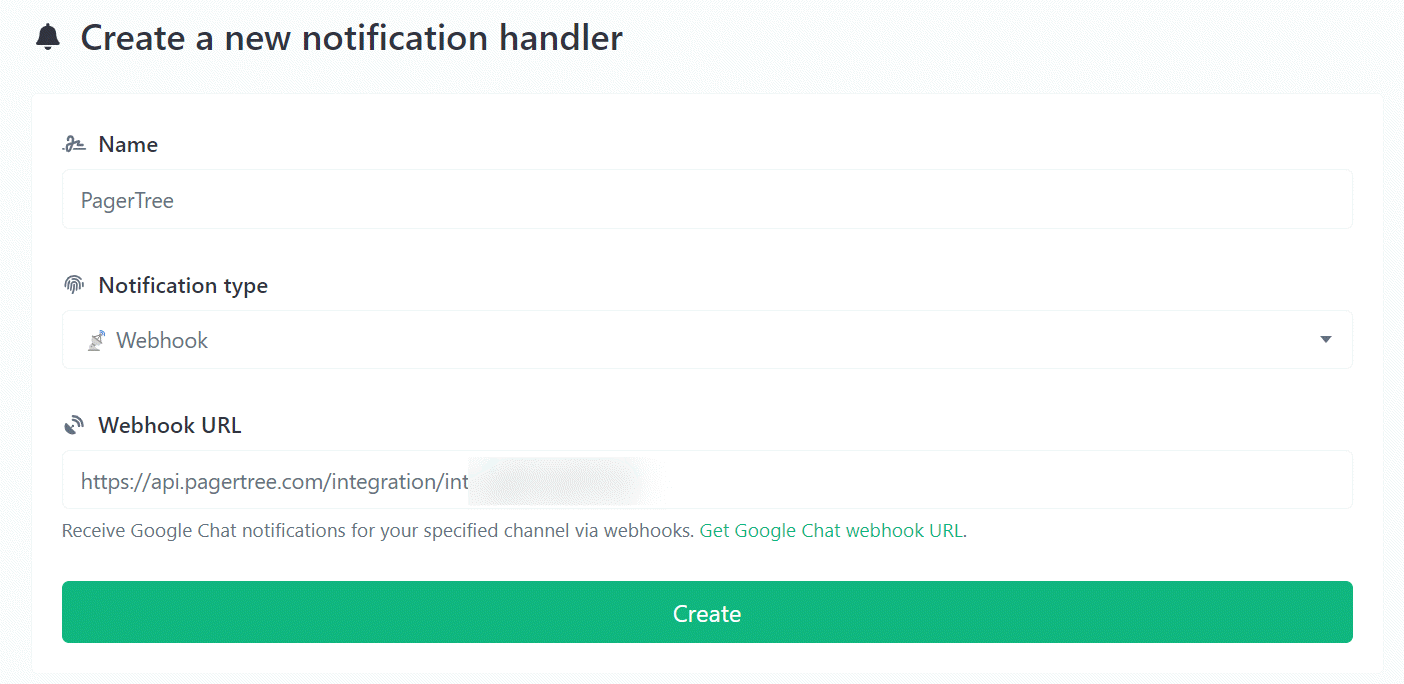
New Notification Handler Form
Attach Notification Handler to Monitors
-
From the Left Menu, navigate to any of your monitors (e.g., Uptime monitors).
-
Select a monitor.
-
Click the Edit button.
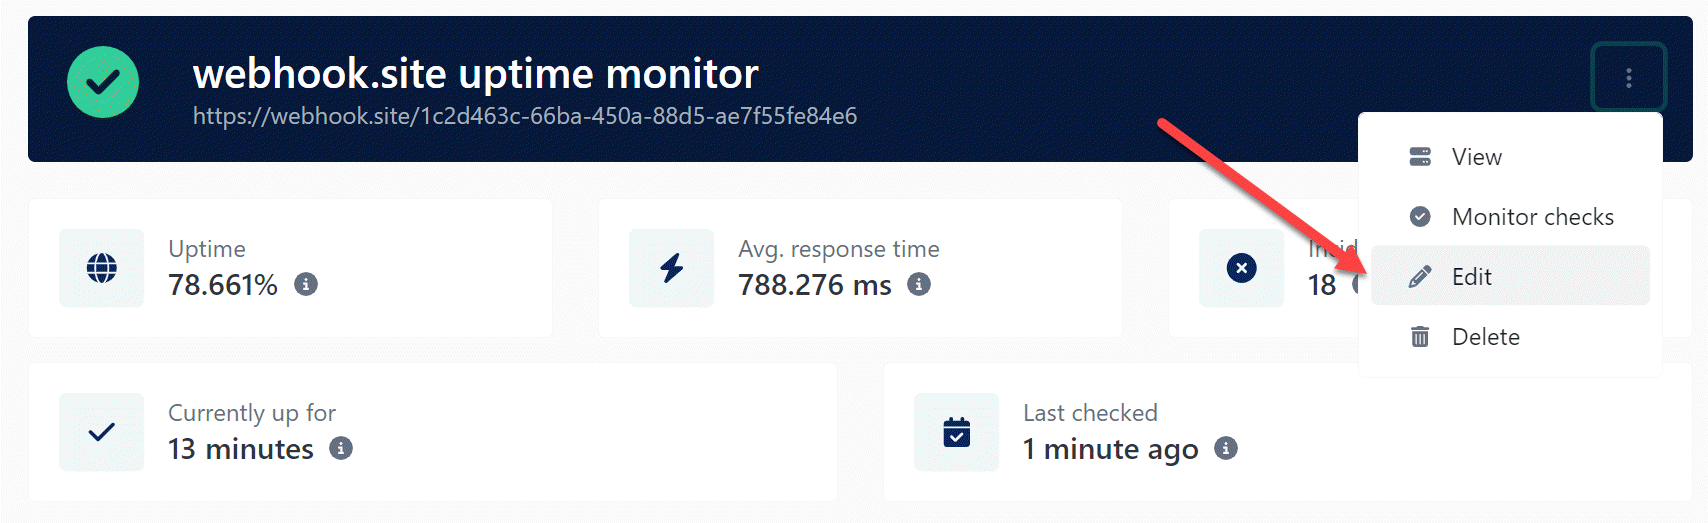
Click edit monitor button.
-
Check the newly created Notification Handler and click Update.
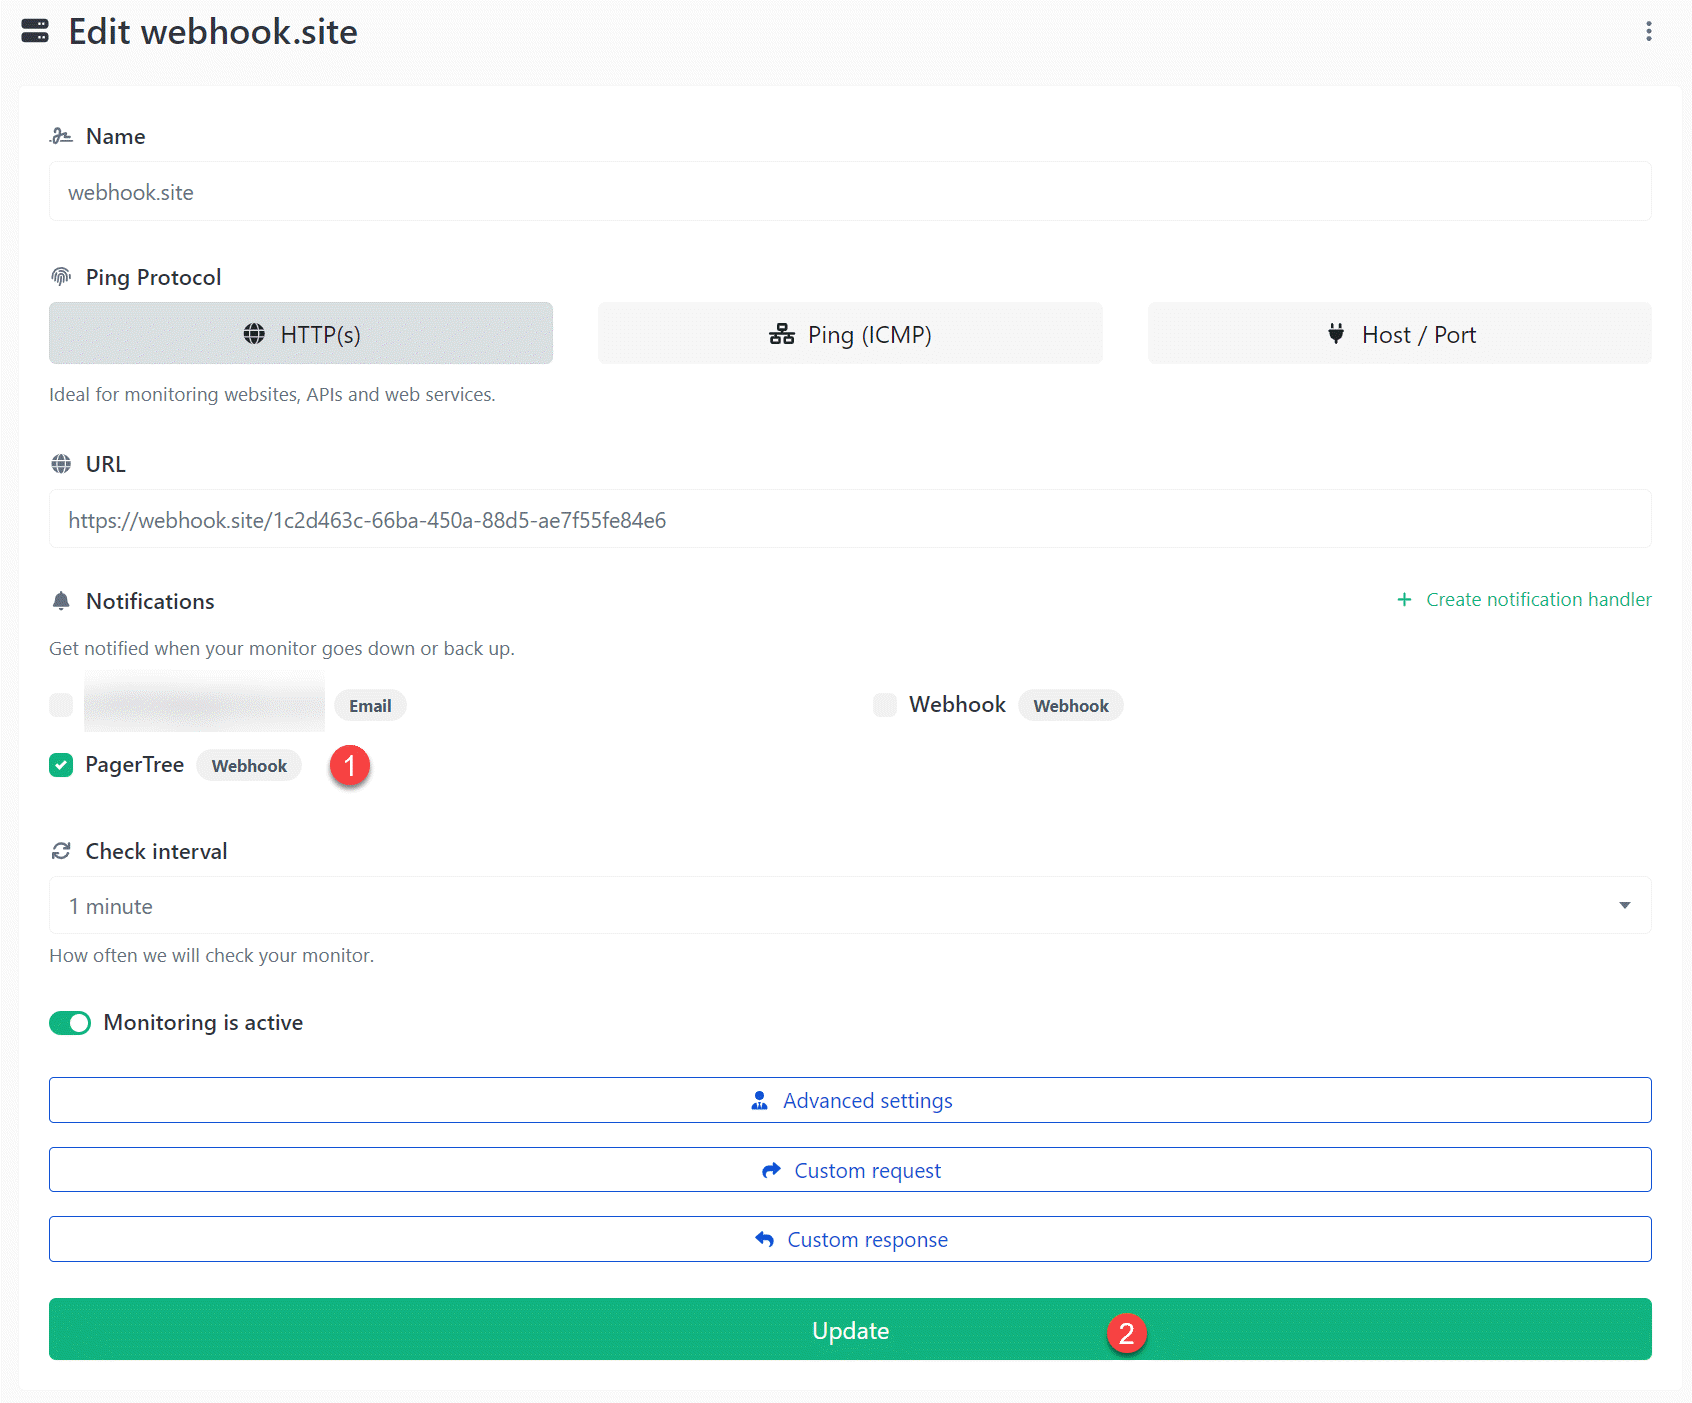
Attach notification handler to uptime check.
You have successfully completed the Hydrozen integration.