Reports
Common Filters
- Start time - The start datetime to consider (inclusive).
- End time - The end datetime to consider (inclusive).
- Time zone - The time zone to report in.
Export to CSV
Report data can be exported to CSV format. To export your data:
- Filter your data.
- Click the Download CSV button.
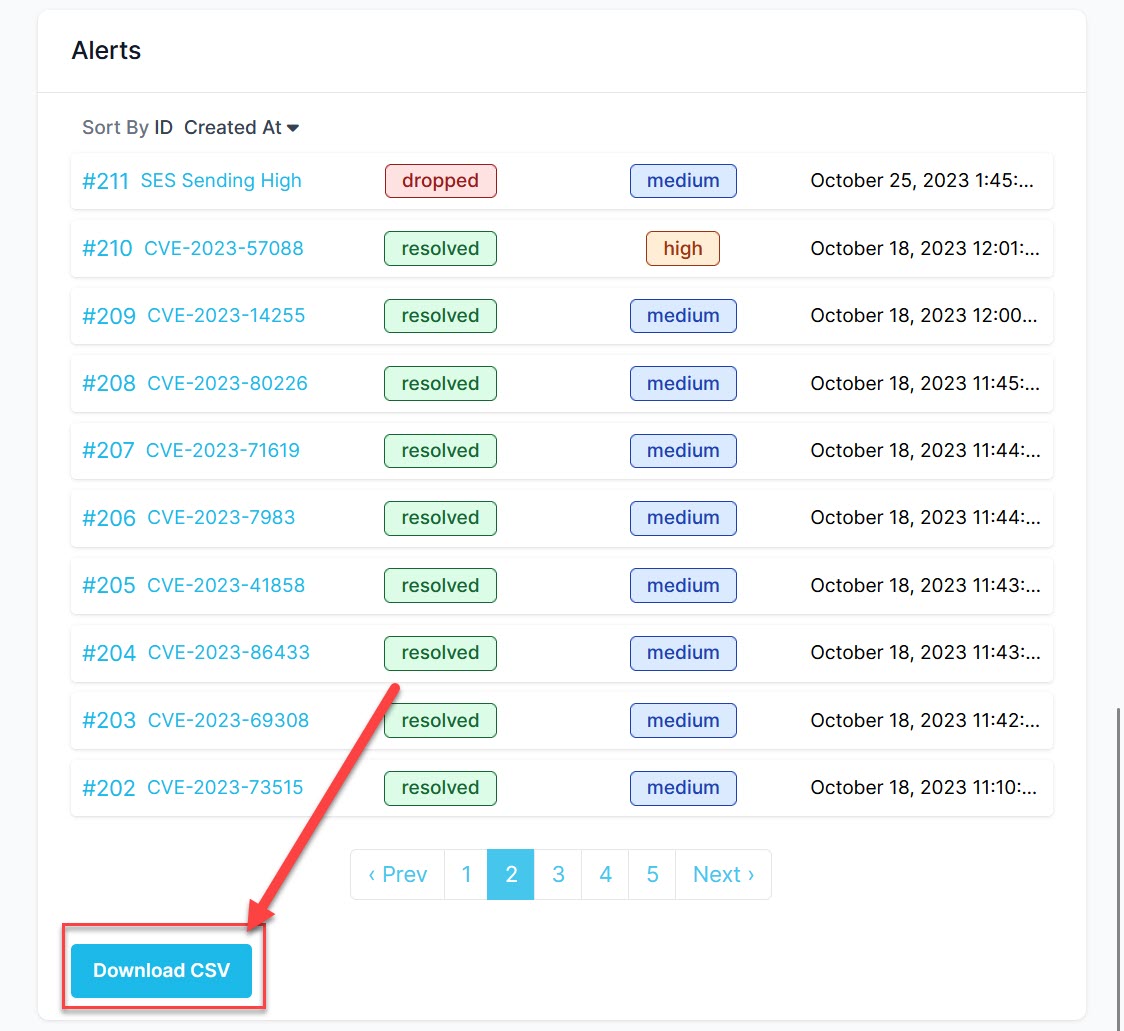
Download CSV button for reports
Alerts Report
The alerts report can show volume (total) alerts over a specified period of time.
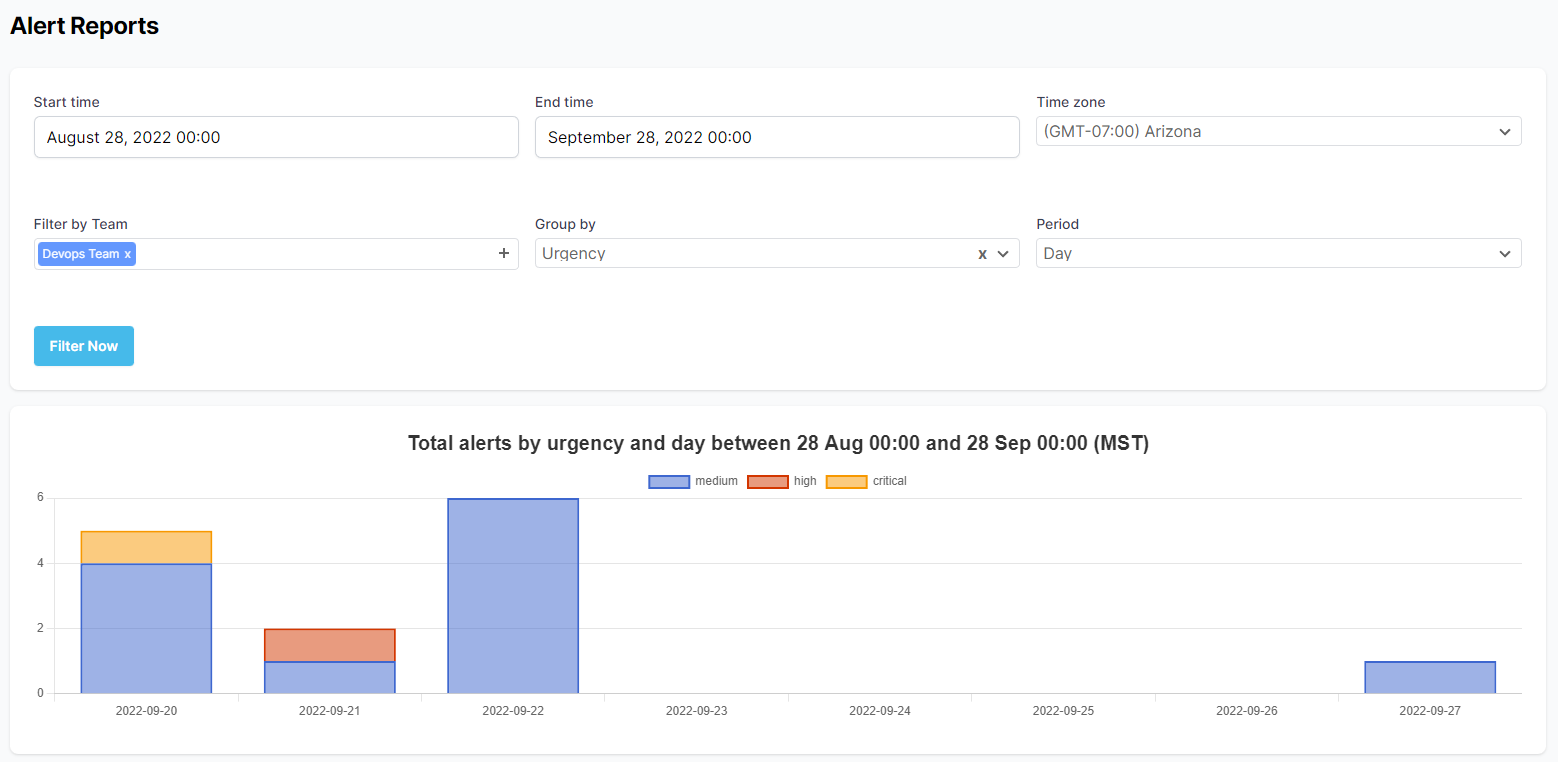
Alerts Report
Additional Options
- Filter by Team - Filter by selected teams (leave blank for all).
- Group by - Options: urgency, status, source, team.
- Period - Unit of time bucket the x-axis.
Teams Reports
The teams reports shows (on a per team basis):
- Total number of alerts
- Total number of alerts acknowledged
- Total number of alerts dropped
- A team's mean time to acknowledge
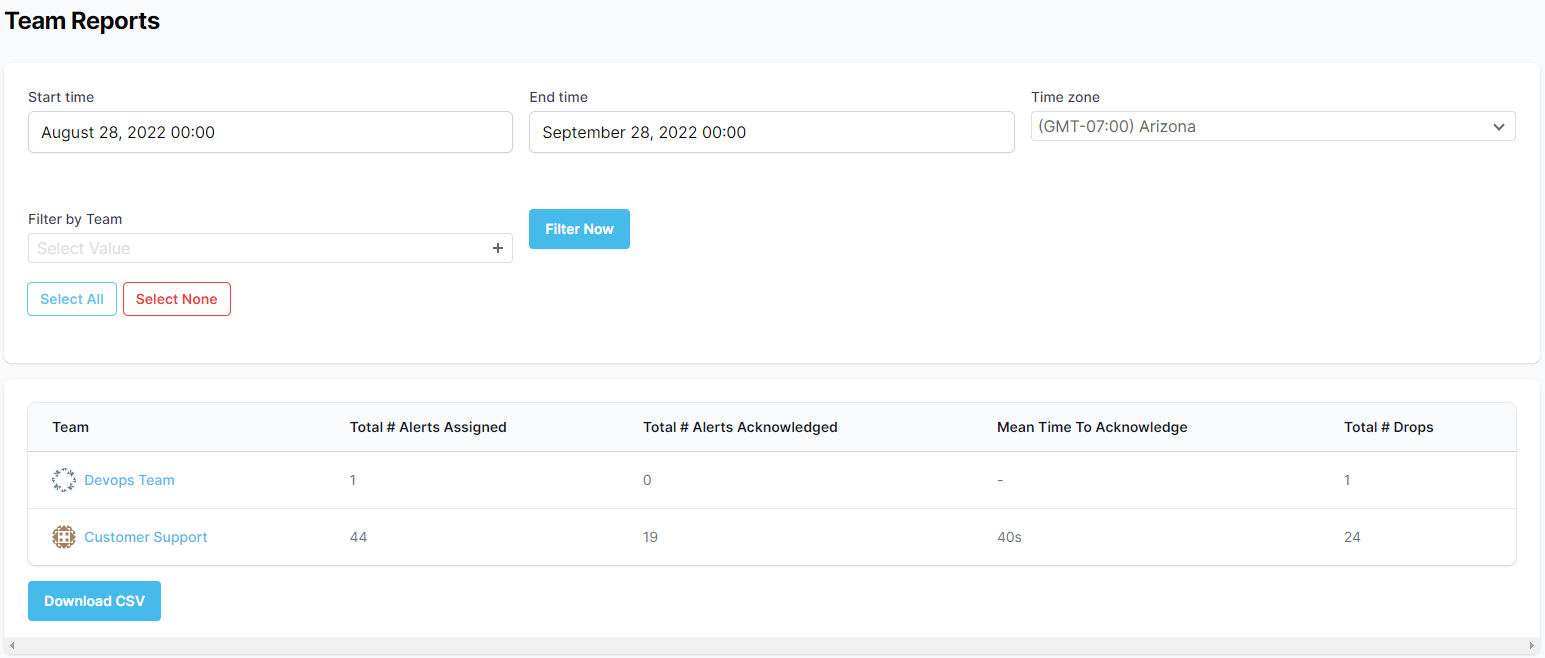
Teams Report
Additional Options
- Filter by Team - Filter by selected teams (leave blank for all).
Users Reports
The users report shows (on a per user basis):
- Total Time On-Call (total man days, overlapping events do not count twice).
- Total number of alerts the user was notified about.
- Total number of alerts the user acknowledged.
- Mean time to acknowledge.
- Total number of rejects.
- Total number of timeouts.
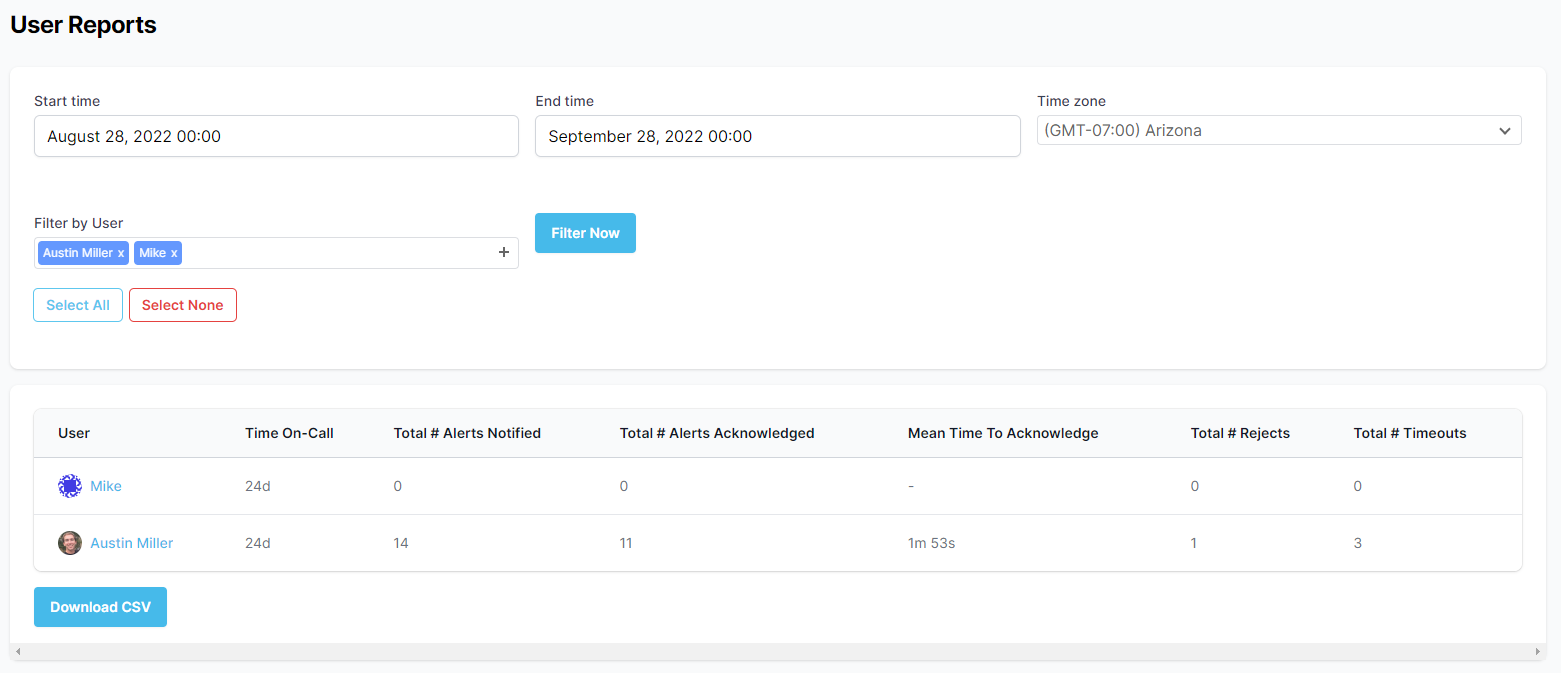
Users Report
Additional Options
- Filter by User - Filter by selected users (leave blank for all).
Notifications Report
The notifications report can show volume (total) of notifications for a period of time.
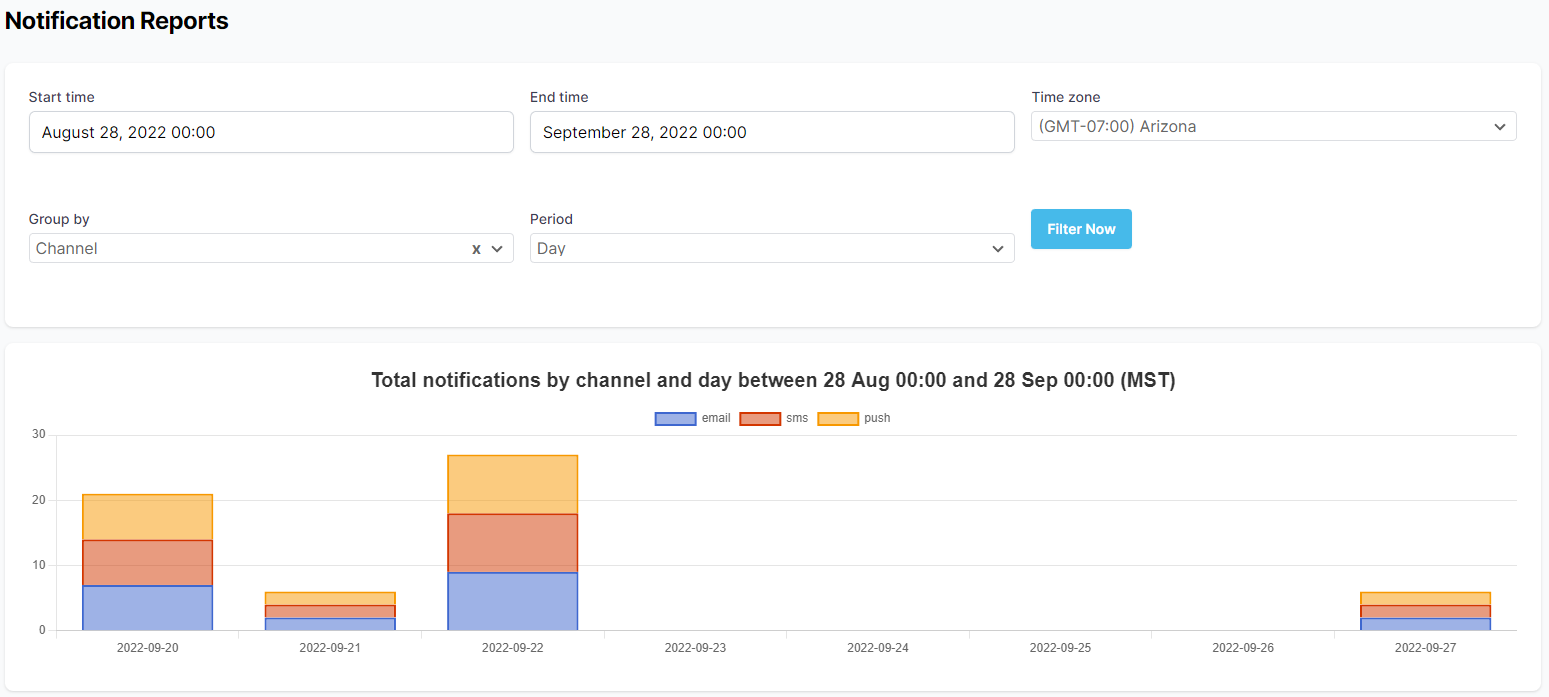
Notifications Report
Additional Options
- Group by - Options: channel, provider, status.
- Period - Unit of time bucket the x-axis.